
Generation Y (‘millennials’) could be the first generation to experience a lesser quality of life than that of their (‘baby boomer’) parents.[i]
Generation Y is faced with unaffordable housing,[ii], earnings and productivity stagnation, zero-hours contracts, relatively thin defined contribution (DC) pension provision plus a defined benefit (DB) desert in the private sector, and a retreating State Pension Age (SPA). Many are also loaded with student debt which, although repayment is income-contingent, can exert a psychological pressure that is alien to previous generations. And while a minority of Generation Y will be substantial beneficiaries of inheritance, they will most likely be living in a world of growing wealth inequality and in-work poverty.
In addition, Generation Y is having to support an ageing population, by funding the rising cost of health and social care. In 2016, there were 3.5 people of working-age for each person of SPA and over in the UK. This is expected to fall to 2.5 by 2036.[iii] The issue of intergenerational unfairness endures, not least because the elderly are more inclined to vote than the young. Notwithstanding the significant decline in pensioner poverty,[iv] which is indicative of past policy success, the elderly enjoy a long litany of ancillary benefits, including: the Winter Fuel Payment, the Christmas Bonus, free prescriptions from aged 60 in England, free TV licences, and subsidised (or free) travel. Inevitably, universally available pensioner benefits come at the expense of the young and subsequent generations.
Politicians, irrespective of hue, continue to fawn to today’s pensioners and baby boomers, evidenced by the vast, and continuing growth in unfunded promises, notably in respect of pensions. Common sense suggests that the ongoing perpetration of intergenerational injustice, conducted largely by stealth and over long timeframes, cannot continue unchecked.
The nation’s financial health
Evidence of the threat to future generations’ economic wellbeing is provided by an examination of the nation’s financial health.
The Office for Budget Responsibility’s (OBR) most recent Fiscal Sustainability Report makes for sobering reading, particularly if you are a member of Generation Y. Its foreword is unambiguous: “The baseline projection in each of our reports – since the first was published in 2011 – has pointed to an unsustainable fiscal position over the long-term.”[v]
The OBR defines an “unsustainable fiscal position” as one in which the public sector is on course to absorb an ever-growing share of national income simply to pay the interest on its accumulated debt.
Public sector net debt, as shown in the ‘National Accounts’, was £1,809 billion at the end of 2018, representing 84% of GDP.[vi] It has been rising faster than the size of the economy every year since 2007-08, so the debt mountain has been growing continuously in GDP terms.
Given the prospect of anaemic economic growth for at least the medium term, the only way to reverse this trend is to cut the fiscal budget deficit through one, or a combination of, spending cuts and higher taxes. Meanwhile, given the scale of the national and personal debt mountains, the Bank of England has very limited scope to raise interest rates.[vii]
Whole of Government Accounts (WGA)
Further evidence of economic unsustainability is provided by HM Treasury’s ‘Whole of Government Accounts’ (‘WGA’). The WGA is based on International Financial Reporting Standards, the system of accounts used internationally by the private sector. It is the only set of consolidated public sector accounts that includes both central government, local government and government-owned corporations. Consequently, it is a more useful for assessing the long-term sustainability of our public finances.
Unlike the National Accounts, the WGA includes a number of unfunded promises, notably £1,697 billion of public service pensions, £138 billion of under-funding of supposedly funded schemes (essentially the Local Government Pension Scheme), provisions (including £185 billion for nuclear decommissioning and £67 billion for clinical negligence), and obligations such as PFI contracts (£79 billion).[viii]
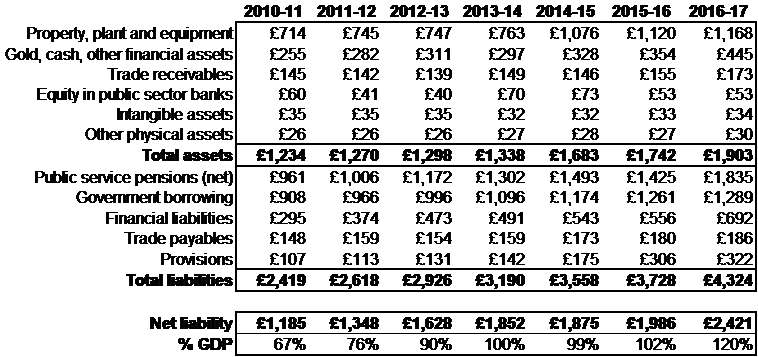
The WGA show that the nation’s net liability more than doubled in the six years to the end of March in 2017 to £2,421 billion, as illustrated in Table 1 below. This is a rate of growth which is, of course, unsustainable. This figure is equivalent to 120% of GDP and £89,000 per household. It is some £694 billion more than the public sector net debt in the National Accounts at the end of March 2017.[ix] If the UK were accounted for as a public company, it would be bankrupt.
However, some of the increase in the nation’s net liability in the WGA is down to exceptional circumstances, namely the financial crisis and the unusually low interest rates that followed. The latter, for example, are partly responsible, through low discount rates, for the huge increase in the unfunded public sector pension liabilities.
Table 1. Whole of Government Accounts (WGA)[x], £ billion
The UK’s liabilities will have to be met by subsequent generations, primarily through taxation. Unlike company shareholders, who can ignore a call for additional equity capital, taxpayers are obliged to pay up. Future taxation receipts are the invisible asset that plugs the balance sheet hole, equivalent to the overall net liability. It represents a call on future generations and assumes their ongoing compliance. This may be a flawed assumption: indeed, the fact that the net liability is rapidly climbing evidences that the Government does not feel it can raise taxes today.
The State Pension
But even the WGA does not provide the whole picture. Bizarrely, the State Pension, the largest of all unfunded liabilities (roughly £4,200 billion at the end of March 2017), is excluded from the WGA. Include it, and UK’s net liability in the WGA would have leapt to over £6,600 billion in March 2017, some £243,000 per household. If the UK were accounted for as a public company, it would be bankrupt.
The State Pension is excluded from the WGA because it is deemed to be a benefit (‘welfare’) rather than an obligation.[xi] It would appear that National Insurance contributions (NICs) do not create any entitlement, hence no liability. HM Treasury’s explanation is that: “The estimate of the public sector pension liability is based on decisions that have already been made in the past regarding entitlement, and therefore a commitment to pay has been made that must be disclosed on the government balance sheet. However, the State Pension is different as the liability to make these payments arises according to the circumstances and legislation prevailing at the time of the claim. Any estimate of overall future payments would be subject to huge uncertainty as the payments will be paid at some point in the future without knowing the exact terms and conditions”.[xii]
The State Pension liability escapes the WGA, seemingly on a technicality. But, that aside, it still has to be met, through taxation. Consequently, in the interests of transparency, it should be included in the WGA. The UK’s Whole of Government Accounts (WGA) balance sheet should include a liability to represent future State Pension payments, based upon a realistic expectation of the future cash outflow, discounted using gilt yields. Such a move would resonate with Sir Steve Webb, the former Pensions Minister, who suggested that the State Pension should be seen as a right, not a benefit, because “it is yours by right, you have paid your national insurance contributions”.[xiii]
Box 1. Student loans: a small step towards full transparency
In a paper for the Centre for Policy Studies in 2017, I described the transition from grant funding to tuition fees and income-contingent loans as an accounting arbitrage at the expense of future taxpayers.[xiv] Student loans are treated as assets, whereas teaching grants were expensed in the year they were made: the outcome was an immediate cut in government expenditure. But given that most of the student loans (and accumulated interest) will now have to be written off 30 years after graduation, the overall effect is to largely defer the bill for a generation.
In December 2018, the Office for National Statistics (ONS) exposed this scandalous arrangement and will change the way student loans are accounted for in the public finances. In future, the Government will expense the forecast unpaid portion of student loans as they are made, which is expected to increase next year’s public sector net borrowing by £12 billion (0.6% of GDP).
This forthcoming change in the accounting status of student loans represents only a small step towards full cost transparency.
Intergenerational Impact Assessments
We need to tackle this ongoing perpetration of intergenerational injustice at source, through a simple intervention mechanism operating right at the heart of the legislative process, one that will arrest Parliament’s output of unfunded spending commitments and provisions.
Prospective legislation is accompanied by a regulatory ‘Impact Assessment’ (‘IA’), an evidence-based document designed to improve the quality of regulation by quantifying its costs and benefits. In the UK, IAs place a particular focus on reducing unnecessary burdens on business, although they can also be used to assess the economic, social, and environmental effects of public policy.
IAs do not, however, explicitly quantify the extent to which costs are being deferred, and thus the financial impact of legislation on the young, as future taxpayers.
The UK should introduce ‘Intergenerational Impact Assessments’ (‘IIAs’) to accompany draft legislation as it proceeds through Parliament. The expressed purpose of IIAs would be to highlight prospective legislation’s cost, efficiency and fairness for future generations. These IIAs would be prepared by a new ‘Office for Fiscal Responsibility’ (‘OFR’), described later.
A key objective for IIAs would be to improve transparency, a prerequisite for any meaningful debate about how longer-term unfunded commitments are to be met and by whom. The process of producing an IIA would hopefully include a long-term cashflow forecast of the unfunded liabilities, to encourage parliamentarians to better appreciate the consequences of their proposals.
If IIAs were to materialise, one indication that they were having an impact would be a marked slowdown in the rate of accumulation of unfunded promises and provisions. But one unfortunate corollary would be, most likely, rising taxation or further spending cuts. And herein lies a multitude of challenges, including ensuring that HM Treasury’s ‘back door’ – namely, tax relief – is firmly under control.
Tax reliefs
There are over 1,100 tax reliefs. Finding a current full list of them is difficult. The most recent, from the Office of Tax Simplification (OTS), dates back to 2015, but it will not have changed substantially. This is summarised in Table 2 below.
Table 2. Number of tax reliefs, 2015[xv]

As Table 3 below shows, HMRC expects tax reliefs to cost a total of over £425 billion in 2018-19,[xvi] the equivalent of 52% of expected tax revenues of £810 billion for 2019-20.[xvii]
HMRC divides tax reliefs into three broader categories:
- (i) structural parts of the tax system (such as the Personal Allowance and the NICs thresholds), expected to cost £196 billion;
- (ii) ‘tax expenditure’ reliefs, designed to relieve tax for particular special interests, or activities to achieve social or economic objectives (£147 billion); and
- (iii) reliefs that combine elements of both structural and expenditure reliefs (£82 billion).
The ten largest tax reliefs account for over 90% of the total cost, mostly in the form of Income Tax and NIC thresholds (40%) and reduced VAT reliefs.
Table 3. Principal tax expenditures and structural reliefs, 2018-19, £ billion

‘Tax expenditure relief’ can arise as a consequence of pressure from narrow commercial interests, rather than being in the national interest. Consider, for example, Income Tax relief on private pensions contributions: since the turn of this century, roughly £429 billion has flowed into the fund management industry, producing billions in annual fee income, making HM Treasury by far its largest client. This is galling given that this particular relief is widely considered to be ineffective in catalysing a savings culture, partly because some 70% of it goes to the top 15% of the income distribution, who are in least need of an incentive to save.[xviii]
Taxpayers deserve regular, thorough and systematic scrutiny of the effectiveness, fairness and value for money of all tax reliefs. In 2015, the House of Commons Public Accounts Committee (PAC) declared that HMRC rarely, if ever, assesses whether tax reliefs are an economic, efficient and effective way of meeting the intended policy objectives.[xix] Some of the PAC’s observations, drawing on an earlier report from the National Audit Office (NAO),[xx] are breath-taking. For example, PAC found that HMRC does not maintain or publish a complete and accurate list of tax reliefs setting out what each is intended to achieve. It publishes a list of 398 tax reliefs: contrast this with the OTS’s 2015 list, in Table 3, which included 1,156 reliefs. Even this OTS list does not include some major items, such as relief provided for capital gains realised by pension funds);
The 2015 PAC report also found of the 398 reliefs on HMRC’s list, only 50% have discernible social or economic objectives. Of these, the cost of 53 of them is unknown, HMRC does not publish cost data for 82 of them, and the cost data for many of the others is inaccurate. In addition, this PAC report found that published costs can significantly exceed forecasts. The reported cited the example of Entrepreneurs’ Relief, the cost of which exceeded HMRC’s forecast by £2 billion.
The PAC report also highlighted systematic use of some reliefs for tax avoidance[xxi], and other substantial abuses, facilitated by HMRC’s and HM Treasury’s lack of curiosity about tax relief costs, as well as the complexity of the system.
One of the most striking revelations contained within the 2015 PAC’s report is that departmental annual budgets are set without taking into account the cost of relevant tax reliefs. This disconnection is extraordinary, and surely leads to resource misallocation, as well as rendering meaningless any value for money exercises. Departmental budgets should be set both gross and net of expenditure on tax reliefs and exemptions, to ensure transparency as to the true level of financial support to each area of public policy.
All of this is quite extraordinary and, consequently, Parliament has little insight as to whether tax reliefs are working as intended, what they cost and whether they are fair and represent good value for money. The sooner that such financial largesse is reined in, the less pressure there will be on HM Treasury and taxpayers.
The 2015 PAC report made some recommendations aimed at improving the process by which HMRC executes its oversight of tax reliefs. But the question remains as to whether HMRC is best placed to do this. The role would probably be more appropriately conducted from within an enhanced Office for Tax Simplification (OTS), which could be renamed the ‘Office for Fiscal Responsibility’ (‘OFR’). The new OFR should pursue a tax simplification agenda alongside an examination of the effectiveness and value for money of all tax reliefs and also coordinate the production of Intergenerational Impact Assessments (IIAs).
To be clear, decisions on tax policy and legislation should remain a matter for the Chancellor. The new OFR would be to provide the Chancellor with supporting material (including IIAs) and recommendations. In respect of reviewing the effectiveness and fairness of tax reliefs, a relatively small investment in technical and behavioural change analytical capabilities has the potential to generate significant return.
An ORF should exude an ethos of fiduciary duty towards current and future taxpayers, and aspire to a reputation for independence akin to that of the Office for Budget Responsibility (OBR).
A revolving programme of tax relief reviews by the OFR could be set in train by attaching a five-year sunset clause to all tax reliefs, distributed throughout a parliamentary term to even out the OFR’s workload. After five years, each and every tax relief would automatically cease. It would then be for politicians and policymakers to periodically remake the case for them. For some of the structural reliefs, this should be a purely perfunctory exercise.
Conclusion
There is no evidence to suggest that the torrent of unfunded promises (and provisions) being made by Parliament will abate anytime soon. The perpetration of intergenerational injustice continues unabated.
This paper makes five main proposals to mitigate intergenerational inequity in government finances:
- The UK’s Whole of Government Accounts (WGA) balance sheet should include a liability to represent future State Pension payments, based upon a realistic expectation of the future cash outflow, discounted using gilt yields.
- Draft legislation should be accompanied by Intergenerational Impact Assessments (IIAs), to quantify its impact on future taxpayers.
- An Office for Fiscal Responsibility (OFR) should be established to coordinate the production of Intergenerational Impact Assessments (IIAs) and to scrutinise the effectiveness and value for money of all tax reliefs.
- All tax reliefs should be subject to a five year sunset clause, after which they would cease.
- Departmental budgets should be set both gross and net of expenditure on tax reliefs, to ensure transparency as to the true level of financial support to each area of public policy.
Collectively, these proposals are intended to improve transparency and to put a brake on deferring costs that Generation Y in particular will otherwise have to meet. It is common to hear politicians complain about intergenerational inequality. But warm words are not enough. A set of bold and original policies are necessary.
Michael Johnson is an Associate Fellow at Bright Blue and a Research Fellow at the Centre for Policy Studies.
Michael trained with JP Morgan in New York and, after 21 years in investment banking, joined Towers Watson, the actuarial consultants. Subsequently he was responsible for the running of David Cameron’s Economic Competitiveness Policy Group.
Michael is the author of more than 40 pensions-related papers published through the CPS, sometimes supported by both Conservative and Labour peers. A number of his proposals have been implemented, including the scrapping the annuitisation requirement (“freedom and choice”), the pooling of the LGPS’s funds, and the introduction of the Lifetime ISA and bonus. More recently he detailed proposals for a Workplace ISA to compete with occupational pension products, residing within the Lifetime ISA.
In April 2018 the Work and Pensions Select Committee endorsed three of Michael’s earlier proposals: there should be a new default decumulation pathway to support the disengaged (“auto-protection”); that NEST should be permitted to provide it; and there should be a single, public, mandatory pension dashboard.
Michael is occasionally consulted on pension reform by serving Ministers, shadow Ministers and the Cabinet Office. He has given oral and written evidence to Select Committees in both Houses of Parliament.
The views expressed in this essay are those of the author, not necessarily those of Bright Blue.
[i] Those born between c. 1980 and 2000 (aged between 19 and 39 today). They are preceded by Generation X (early 1960s to 1979 births) and the post-war baby boomers, born between 1946 and the early 1960s.
[ii] 28% of those aged 25 to 34 now own their own home, down from over 50% in 1990. This data is for families (singles or couples) for Q3 of 2018; Office for National Statistics, “Labour force survey”, https://www.ons.gov.uk/releases/uklabourmarketstatisticsoct2018 (2018).
[iii] ONS, “Overview of the UK population”, https://www.ons.gov.uk/peoplepopulationandcommunity/populationandmigration/populationestimates/articles/overviewoftheukpopulation/july2017 (2017).
[iv] Over the last 20 years, the proportion of single pensioners living in poverty (defined as anyone with income below 60% of the median income) has dropped from 36% to 20% (for couples: from 22% to12%). Department for Work and Pensions, “Households below average income, 1994/95-2016/17”; https://www.gov.uk/government/statistics/households-below-average-income-199495-to-201617 (2018).
[v] Office for Budget Responsibility, “Fiscal sustainability report”, https://obr.uk/report/fiscal-sustainability-report/ (2018).
[vi] ONS, “Public sector finances, UK: December 2018”, https://www.ons.gov.uk/economy/governmentpublicsectorandtaxes/publicsectorfinance/bulletins/publicsectorfinances/december2018 (2018).
[vii] Borrowing in the current financial year was £35.9 billion at the end of December 2018, £13.1 billion less than in the same period in 2017. This is the lowest year-to-date figure since 2002. Consequently. we should expect 2018-19 to produce a fall in the debt / GDP ratio.
[viii] See Notes 24, 22 and 27 of HM Treasury, “Whole of government accounts: year ended 31 March 2017”, https://www.gov.uk/government/publications/whole-of-government-accounts-2016-to-2017, (2018).
[ix] HM Treasury, “Autumn budget 2017”, https://assets.publishing.service.gov.uk/government/uploads/system/uploads/attachment_data/file/661480/autumn_budget_2017_web.pdf (2017), 79.
[x] HMT, “Whole of government accounts”. Data for 2017-18 is not expected until late 2019.
[xi] According to HM Treasury, all liabilities recognised in the WGA must follow the private sector’s International Financial Reporting Standards. The State Pension does not meet the recognition criteria.
[xii] With regards to the last sentence, the same could be said of public service pensions: witness the changes resulting from Lord Hutton’s review which, by linking payment to the State Pension age, significantly changes (long-term) future payments.
[xiii] Peter Dominiczak and Steven Swinford, “State pension is not a benefit, says minister”, Daily Telegraph, https://www.telegraph.co.uk/finance/personalfinance/pensions/11194265/State-pension-is-not-a-benefit-says-minister.html 28 October, 2014.
[xiv] Michael Johnson, Tuition fees: a fairer formula (London: Centre for Policy Studies, 2017)
[xv] Office of Tax Simplification, “Finance act 2015 – new tax reliefs”, https://taxsimplificationblog.wordpress.com/2015/03/27/finance-act-2015-new-tax-reliefs/ (2015).
[xvi] HM Revenue & Customs, “Estimated costs of the principal tax expenditure and structural reliefs”, https://www.gov.uk/government/statistics/main-tax-expenditures-and-structural-reliefs (2019).
[xvii] Comprising (£ billion): Income Tax £193, VAT £156, NICs £142, Corporation Tax £60, Excise duties £50, Council tax £36, Business rates £31, other taxes £89, and non-taxes of £54. HM Treasury, “Budget 2018”, https://assets.publishing.service.gov.uk/government/uploads/system/uploads/attachment_data/file/752202/Budget_2018_red_web.pdf (2018), 5.
[xviii] Michael Johnson, Five proposals to simplify saving (London: Centre for Policy Studies, 2018).
[xix] House of Commons Committee of Public Accounts, “The effective management of tax reliefs; forty-ninth Report of Session 2014–15”, https://publications.parliament.uk/pa/cm201415/cmselect/cmpubacc/892/892.pdf (2015).
[xx] National Audit Office, “The effective management of tax reliefs”, https://www.nao.org.uk/wp-content/uploads/2014/11/Effective-management-of-tax-reliefs.pdf (2014).
[xxi] Notably Share Loss relief, Business Premises Renovation Allowance, and Film Tax Relief.